


Heading 1
Heading 2
Heading 3
Heading 4
Heading 5
Heading 6
Lorem ipsum dolor sit amet, consectetur adipiscing elit, sed do eiusmod tempor incididunt ut labore et dolore magna aliqua. Ut enim ad minim veniam, quis nostrud exercitation ullamco laboris nisi ut aliquip ex ea commodo consequat. Duis aute irure dolor in reprehenderit in voluptate velit esse cillum dolore eu fugiat nulla pariatur.
Block quote
Ordered list
- Item 1
- Item 2
- Item 3
Unordered list
- Item A
- Item B
- Item C
Bold text
Emphasis
Superscript
Subscript
About This Simulation
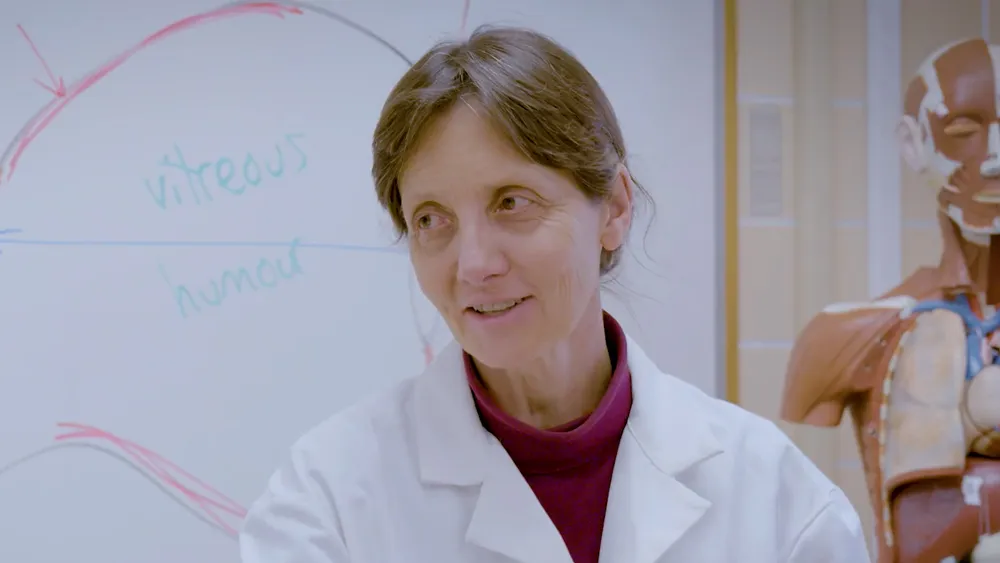
Learn how to generate and interpret the heating curves of ethanol and water. Discover how to relate heating curve data to the recorded observations of the substance on heating and determine the physical properties from the generated curve.
Learning Objectives
- Explain solid, liquid, and gas states in terms of particle interaction and bonding energy
- Describe and explain the characteristics of a phase change
- Read a phase diagram and explain each region
- Interpret a heating curve of a given substance
- Explain the difference between a heating curve and a phase diagram, and the difference between specific heat and latent heat


About This Simulation
Lab Techniques
- Heating Curves
- Phase Changes
Related Standards
- Early Stage Bachelors Level
- US College Year 1
- US College Year 2
- FHEQ 6
- EHEA First Cycle
- EHEA Short Cycle
- HS-PS1-3
- HS-PS1-4
- HS-PS1-7
- HS-PS1-5
- PS1.A-E2
- Chemistry 2.2 Intermolecular Force and Potential Energy
- Chemistry 3.1. Intermolecular Forces
- Chemistry 3.2 Properties of Solids
- Chemistry 4.4 Physical and Chemical Changes
- Chemistry 6.5 Energy of Phase Changes
- Chemistry 4.4 Intermolecular forces
Learn More About This Simulation
This short, targeted simulation is adapted from the full-length “Matter and Phase Changes: Distil ethanol” simulation.
Heating curves aren’t like any other graphs, they have a story to tell about a substance. In this simulation, you will be generating the heating curve for water and ethanol through a small experiment of your own. You will observe the substance upon heating and correlate these observations to the data recorded on the heat curve. Will you be able to identify the physical properties of ethanol and water from the heating curve?
Get familiar with the three states of matter
Look closely at three examples of elements each in a different state of matter: solid, liquid or gas. Familiarise yourself with the difference between the three through these physical examples before moving on to examining the physical changes of a substance from one state of matter to another.
Generate heating curves
Once you’ve mastered the basics, you are ready to learn about additional aspects of phase changes: Specific heat, latent heat, and pressure. You will utilize a temperature probe and a heat plate to generate a heating curve and then compare the heating curve of water, ethanol, and metal. By doing so, you will be able to decode the meaning of each line of the heating curves.
Examine the heating curve closely through our interactive screen activity where you will get tested on each section of curve and what information this provides on the physical properties of the substance.
Learn about phase changes
Did you know that heating curves and phase changes are related? Learn how to identify the phase changes of each substance through the physical property observations and understand the science behind the phase change from solid to liquid and a liquid to a gas.
Discover how heating curves indicate the temperatures at which these phase changes occur.
Will you be able to generate the heating curve of a substance with the understanding of how this relates to the occurring phase changes?
Related Course
+20 other courses

Homogenization: Developing better-tasting milk
Help Adam the farmer grow his milk business by exploring the basic concepts of homogenization, a standard procedure in milk processing.
.png?fm=jpg&w=450&h=400 "Sudan IV Test for Lipids")
Sudan IV Test for Lipids
Have you ever wondered what fat is? Discover the structure of lipids and how you can test for the presence of lipids in food samples.

The Scientific Method
Work as a pharmaceutical detective to identify the link between a new drug and a recent epidemic. Use the scientific method to come up with a hypothesis and subsequently design an experiment that will test the validity of your hypothesis.
For Science Programs Providing a Learning Advantage
North Dakota State College of Science
“They did the simulation at home, then completed the in-person lab within 30 minutes, no questions asked, and passed the quiz with flying colors.”

Lecturer in Human Physiology
University of Westminster
"I saw some of the students who clearly didn’t necessarily like sitting there reading a book discover they could turn on Labster and keep up with the rest of the class because it spoke to them.

Modesto City Schools
"Having something that's engaging for the students gives teachers that opportunity to breathe and get excited again. Because they're seeing the kids light up, they're seeing the kids engage with content."

Wenatchee Valley College
"The question always is, ‘Can we demonstrate that the students are meeting course outcomes?’ Check! We can do that.”

San José State University
"We surveyed over 400 students. More than 90% thought Labster was easy to navigate, and that it was fun, but more importantly, most of them felt confident that they could execute the labs in person. And that confidence is a big deal."

Boost STEM Pass Rates
Boost Learning with Fun
75% of students show high engagement and improved grades with Labster
Discover Simulations That Match Your Syllabus
Easily bolster your learning objectives with relevant, interactive content
Place Students in the Shoes of Real Scientists
Practice a lab procedure or visualize theory through narrative-driven scenarios


FAQs
Find answers to frequently asked questions.
Heading 1
Heading 2
Heading 3
Heading 4
Heading 5
Heading 6
Lorem ipsum dolor sit amet, consectetur adipiscing elit, sed do eiusmod tempor incididunt ut labore et dolore magna aliqua. Ut enim ad minim veniam, quis nostrud exercitation ullamco laboris nisi ut aliquip ex ea commodo consequat. Duis aute irure dolor in reprehenderit in voluptate velit esse cillum dolore eu fugiat nulla pariatur.
Block quote
Ordered list
- Item 1
- Item 2
- Item 3
Unordered list
- Item A
- Item B
- Item C
Bold text
Emphasis
Superscript
Subscript
A Labster virtual lab is an interactive, multimedia assignment that students access right from their computers. Many Labster virtual labs prepare students for success in college by introducing foundational knowledge using multimedia visualizations that make it easier to understand complex concepts. Other Labster virtual labs prepare learners for careers in STEM labs by giving them realistic practice on lab techniques and procedures.
Labster’s virtual lab simulations are created by scientists and designed to maximize engagement and interactivity. Unlike watching a video or reading a textbook, Labster virtual labs are interactive. To make progress, students must think critically and solve a real-world problem. We believe that learning by doing makes STEM stick.
Yes, Labster is compatible with all major LMS (Learning Management Systems) including Blackboard, Canvas, D2L, Moodle, and many others. Students can access Labster like any other assignment. If your institution does not choose an LMS integration, students will log into Labster’s Course Manager once they have an account created. Your institution will decide which is the best access method.
Labster is available for purchase by instructors, faculty, and administrators at education institutions. Purchasing our starter package, Labster Explorer, can be done using a credit card if you are located in the USA, Canada, or Mexico. If you are outside of North America or are choosing a higher plan, please speak with a Labster sales representative. Compare plans.
Labster supports a wide range of STEM courses at the high school, college, and university level across fields in biology, chemistry, physics, and health sciences. You can identify topics for your courses by searching our Content Catalog.