


Heading 1
Heading 2
Heading 3
Heading 4
Heading 5
Heading 6
Lorem ipsum dolor sit amet, consectetur adipiscing elit, sed do eiusmod tempor incididunt ut labore et dolore magna aliqua. Ut enim ad minim veniam, quis nostrud exercitation ullamco laboris nisi ut aliquip ex ea commodo consequat. Duis aute irure dolor in reprehenderit in voluptate velit esse cillum dolore eu fugiat nulla pariatur.
Block quote
Ordered list
- Item 1
- Item 2
- Item 3
Unordered list
- Item A
- Item B
- Item C
Bold text
Emphasis
Superscript
Subscript
Simulation Details
Learning Objectives
- Understand the basic concepts of sample collection
- Analyze the level of dissolved oxygen level in your water sample using a spectrophotometer
- Learn the concepts of a calibration curve, linear regression and extrapolation

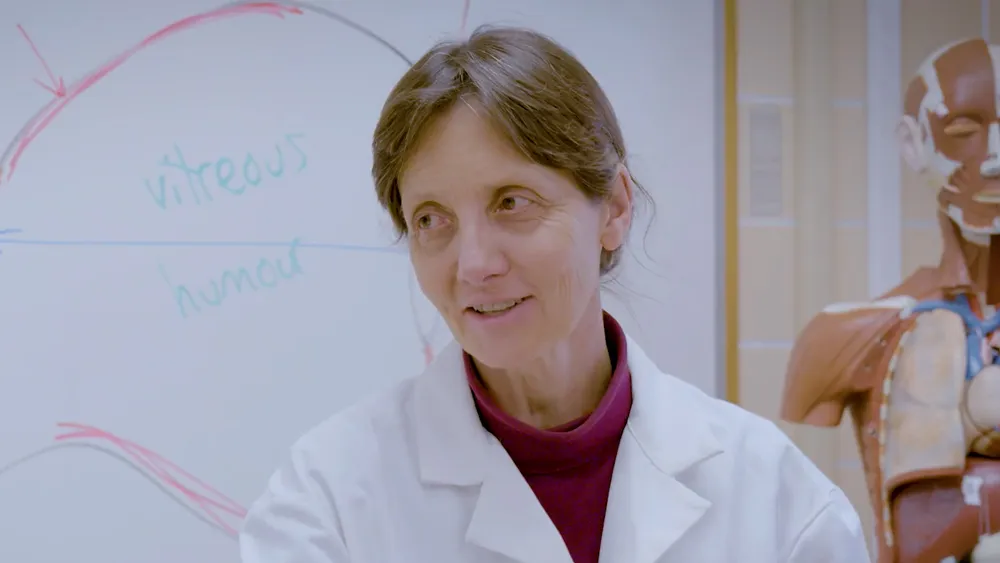
.png "Preview of MB1_(1).png simulation.")
.png "Preview of MB1_(3).png simulation.")
.png "Preview of MB1_(2).png simulation.")
Lab Techniques
- Spectrophotometry
- Sampling
Related Standards
- No direct alignment
- Environmental Science 1.3 Aquatic biomes
- Environmental Science 8.6 Thermal pollution
- Biology Topic 5: Evolution and biodiversity
Related Course
+20 other courses


See How Science Programs Are Turning Curiosity Into Action and Mistakes Into Learning
North Dakota State College of Science
“They did the simulation at home, then completed the in-person lab within 30 minutes, no questions asked, and passed the quiz with flying colors.”

University of Westminster
"I saw some of the students who clearly didn’t necessarily like sitting there reading a book discover they could turn on Labster and keep up with the rest of the class because it spoke to them.
Modesto City Schools
"Having something that's engaging for the students gives teachers that opportunity to breathe and get excited again. Because they're seeing the kids light up, they're seeing the kids engage with content."

Wenatchee Valley College
"The question always is, ‘Can we demonstrate that the students are meeting course outcomes?’ Check! We can do that.”

San José State University
"We surveyed over 400 students. More than 90% thought Labster was easy to navigate, and that it was fun, but more importantly, most of them felt confident that they could execute the labs in person. And that confidence is a big deal."

Find Virtual Labs That Perfectly Match Your Syllabus
Get Instant, Personalized Recommendations to Help Reinforce Your Course Content

Frequently Asked Questions
Heading 1
Heading 2
Heading 3
Heading 4
Heading 5
Heading 6
Lorem ipsum dolor sit amet, consectetur adipiscing elit, sed do eiusmod tempor incididunt ut labore et dolore magna aliqua. Ut enim ad minim veniam, quis nostrud exercitation ullamco laboris nisi ut aliquip ex ea commodo consequat. Duis aute irure dolor in reprehenderit in voluptate velit esse cillum dolore eu fugiat nulla pariatur.
Block quote
Ordered list
- Item 1
- Item 2
- Item 3
Unordered list
- Item A
- Item B
- Item C
Bold text
Emphasis
Superscript
Subscript
A Labster virtual lab is an interactive, multimedia assignment that students access right from their computers. Many Labster virtual labs prepare students for success in college by introducing foundational knowledge using multimedia visualizations that make it easier to understand complex concepts. Other Labster virtual labs prepare learners for careers in STEM labs by giving them realistic practice on lab techniques and procedures.
Labster supports a wide range of STEM courses at the high school, college, and university level across fields in biology, chemistry, physics, and health sciences. You can identify topics for your courses by searching our Content Catalog.
Yes, Labster is compatible with all major LMS (Learning Management Systems) including Blackboard, Canvas, D2L, Moodle, and many others. Students can access Labster like any other assignment. If your institution does not choose an LMS integration, students will log into Labster’s Course Manager once they have an account created. Your institution will decide which is the best access method.